How are you managing it all?

There is some interesting data coming out about the housing recovery during COVID and what it means for buyers and sellers. In general, 2021 has started out as one of the most active times for real estate in recent memory. Incredibly low interest rates have made money almost free – not quite, but almost – and buyers are seeing that now is the time to get while the getting is good. For people with excellent credit and 20% down, it costs somewhere between $400-$450 per month for every $100,000 borrowed. Cheap money, indeed.
To the low interests, add low inventory, and you have a mini buying frenzy. According to Realtor.com’s Housing Market Recovery Index, new listings are down as much as a whopping 35% from the same time last year. A closer look at week-over-week new listing inventory, country-wide:
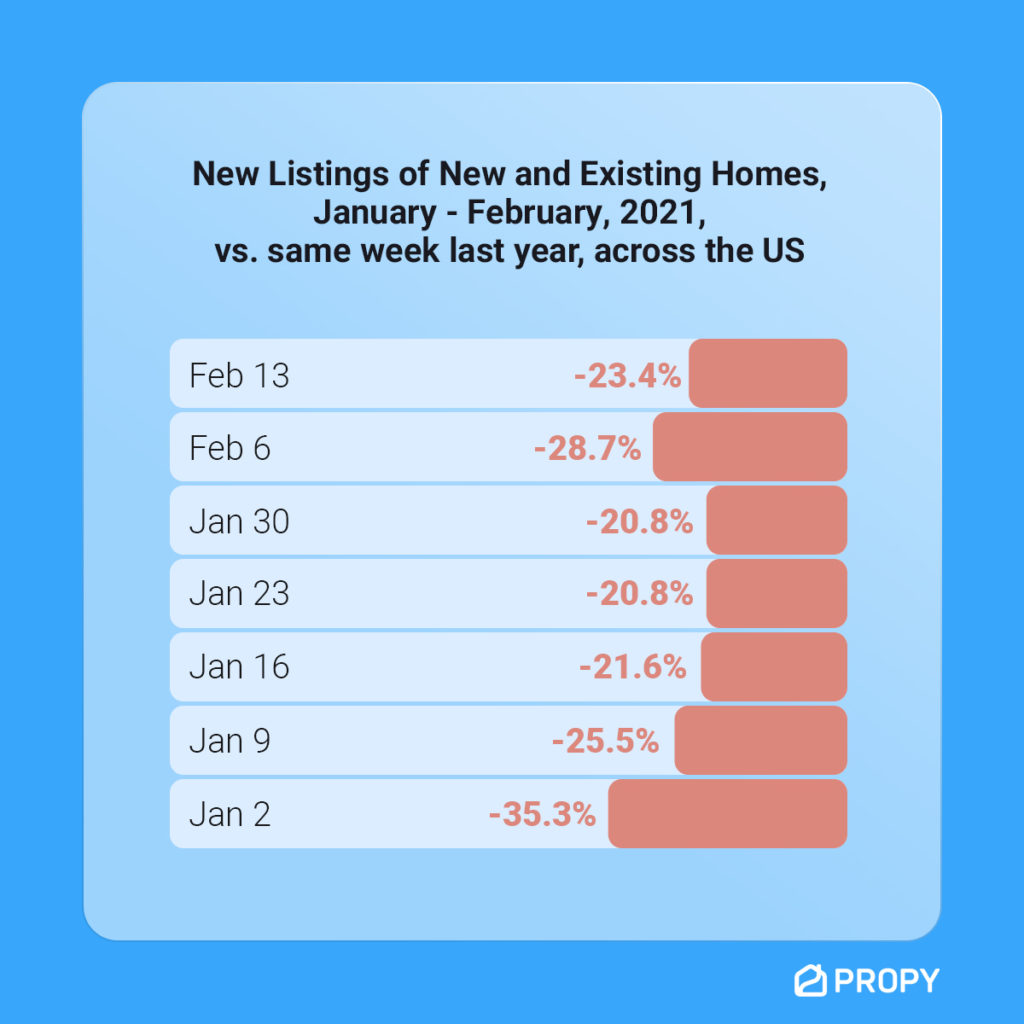
The holidays always account for much of this decrease in activity, of course, but that doesn’t explain the comparison for the same time last year, so we think it’s primarily due to the uncertainty that COVID has cast upon us all. When we look deeper, we see that most of the decrease in listing activity is centered around major metro areas. People who have held aspirations to sell have dashed those thoughts because the pandemic has left people with the desire to move away from the cities, not into them. Couple that with major groundhog day syndrome – each day seeming like that last – and people might just be looking for new scenery.
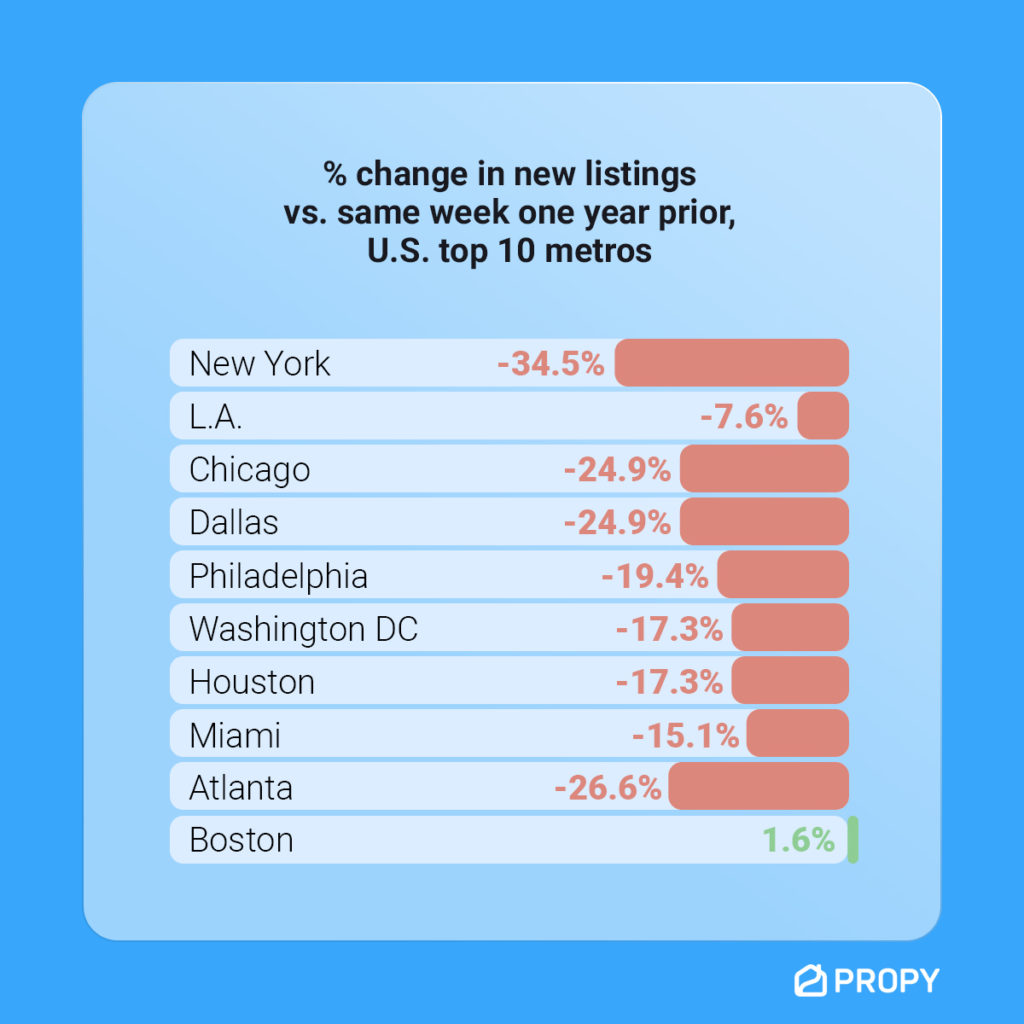
Likewise, the decrease in new listings since the start of 2021 has, on a percentage basis, been happening most in those same major metro areas. The 10 largest cities and their outlying areas in the US all have seen significant decreases in the number of week-over-week new listings this year:
Demand is up ( because of low interest rates) and supply is down (because of COVID uncertainty – well, at least in the major metros). The result? Multiple offer scenarios are everywhere across the country, but not necessarily in the same metros where new listings are decreasing, which exacerbates the frenzy!
In one study, we discovered that in many primary metro areas, there was an average of 19 offers per listing on single family homes and condominiums. In a few of the cases, there was an average of over 40 offers per listing. That is almost unprecedented and certainly cause for joyful concern if you are a brokerage or agent.
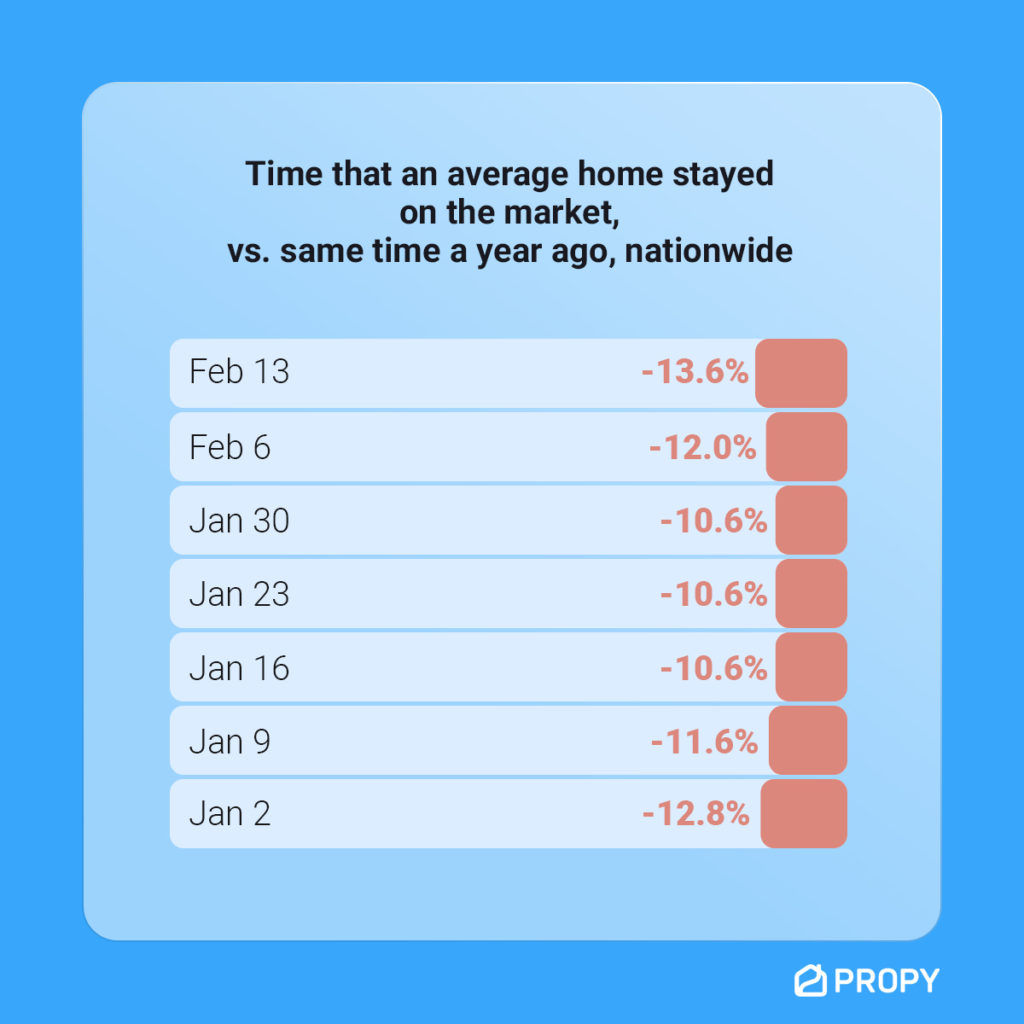
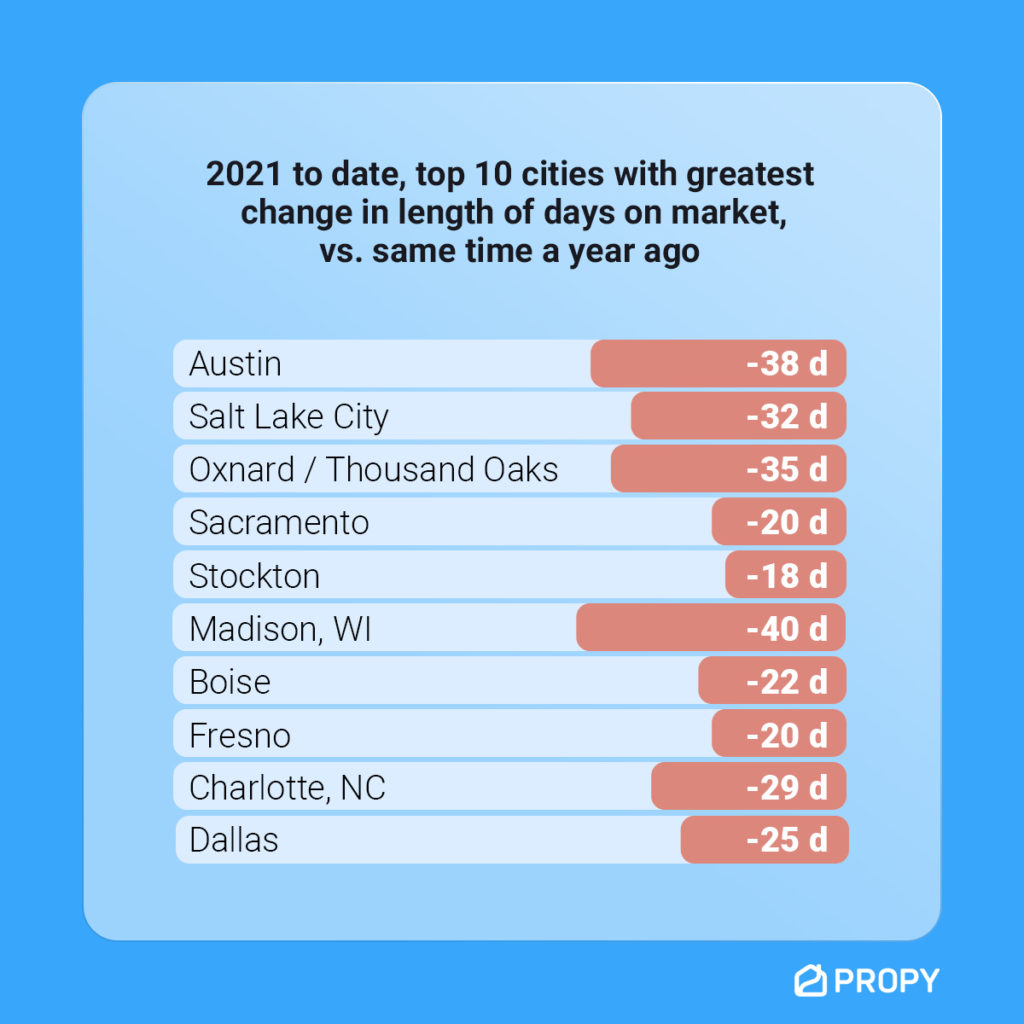
As for inventory selling quickly, only one of the top 10 metro areas (Dallas) saw a decrease in the average number of days on market vs. the same time a year ago. The other 9 have seem to become destination locales due to things like COVID and affordability, and properties there are moving super fast. In fact, nationwide, homes sold an average of 11.37% faster than the same time a year ago.
So, what is clear is this: there are fewer properties on the market than a year ago, people have been making the move away from the largest metro areas to new places (see our thoughts on whether that trend will continue here) and the country is in a multiple offer scenario, without a hint of doubt.
What are you seeing in your area? How many offers are your listings generating? How much over or under asking are they getting? And importantly, how are you managing the offers for every listing that you carry?
Follow us on Twitter and Facebook and become part of the conversation. We want to hear from you!